As discussed on uncovermarkets.in, our prediction for NIFTY on December 4th accurately anticipated the index peaking just below the 25,000 mark. We highlighted the likelihood of NIFTY losing momentum before reaching 25,000, suggesting it was a trap rally. This analysis has once again proven our expertise. You can read the full article here.
Similarly, on December 6th, we predicted that the top for Bank NIFTY had already been reached. Our forecasts for both NIFTY and Bank NIFTY levels were contrary to most experts, who predicted a significant upside. Our meticulous research has been validated, as you can see in our Bank NIFTY prediction here.
Additionally, around November 17th, we accurately predicted the bottom levels for Bank NIFTY, with the market turning up from the specific area we highlighted. You can check the details here.
Now, the big question is: What’s next for NIFTY levels? Let’s dive deep into the analysis. So, to get into that, we first look that 3 key graphs : Dollar index, 10Y US Treasury yields, and Crude oil charts.
First chart below gives details about Dollar index: It looks like it has already reached the peak and might start to fall down from 108.2 levels. However, it my also rise by 2 % more, so topping around 110.2 levels in normally expected scenario. This is a good news for NIFTY as once DXY starts to fall down, NIFTY will see more bullishness. We are expecting some weeks into higher dollar index before it cools off, but neverthless, it should be respecting the levels that we have predicted here. When exactly it falls down and by how much, we can’t be sure about it as of now. So, we expected 2-3 weeks of elevated levels at least. Now, lets go down to US 10Y Treasury yields graph, see the 2nd chart below.

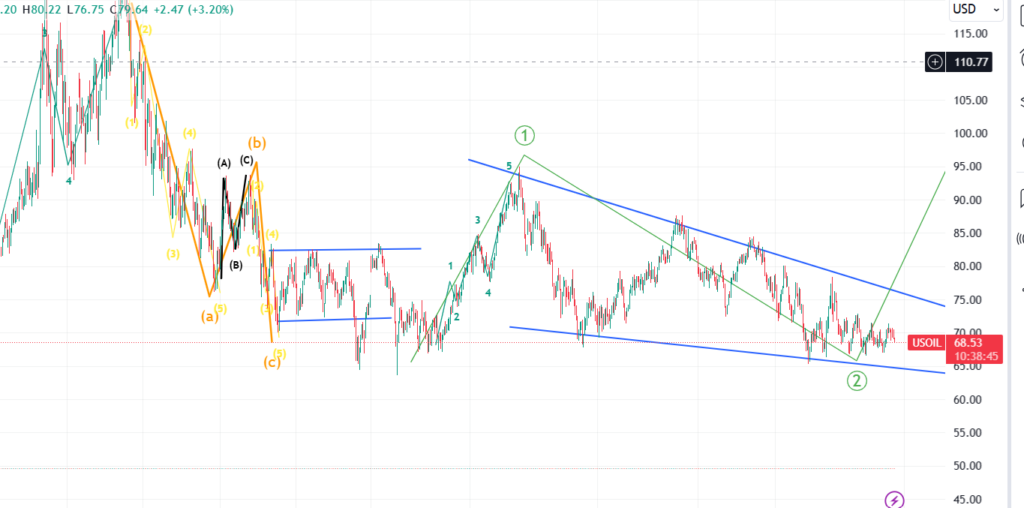
Below Graph shows 10 Y US yields: You can see, it has crossed our first level of resistance already, and now staring to go by further to around 4.65 to 4.8%. So, it may take some weeks to slowly reach that level before falling down. This makes short term scenario for NIFTY subdued or range bound with negative bias. Similar to Dollar index indication, from now, after few weeks, we may start anticipating a fall in both of these index and that will bring cheers to Nifty back again. Lets go to the oil chart now, considering we have been observing currency delcine (Ruppe against dollar) and also CAD (current Account Deficit) is also at a high, so oil prices are going to impact our markets in coming days. In a nutshell, this is also a very good proxy for middle east crisis. lets go to that chart then.

Crude oil chart below: All the indicators are making it a very complex lookng chart, howerver the only thing worth understanding here is that Crude is looking to bounce up sharply. And that is a bad news for NIFTY and our overall broader stock market as well. Now, let’s finally, let’s give our verdict on NIFTY by looking at its chart.

Look at the NIFTY chart below. This is the same chart which I had published around 4th December and marking correctly the end of pull back at point B (which is just around 25,000. Now, NIFTY looks all set to touch 23,000 and although it is supposed to go further down till 22,000, but we are hopeful that strong SIP flows into mutual funds and recent strength of retail participation would try to arrest that fall. So, first strong support could emerge around 23,300, and then 23,000. If it falls below that, we will just stay away from the market until the fall has been completed and it could be around 22,000 or even below. Those predictions will be made once we see 23,000 levels broken, we hope that we don’t go that far due to retail participation. But signs look bleak as of now. In a nutshell, 23000 is our support as of now. If any rallies, just do sell on rise!!


