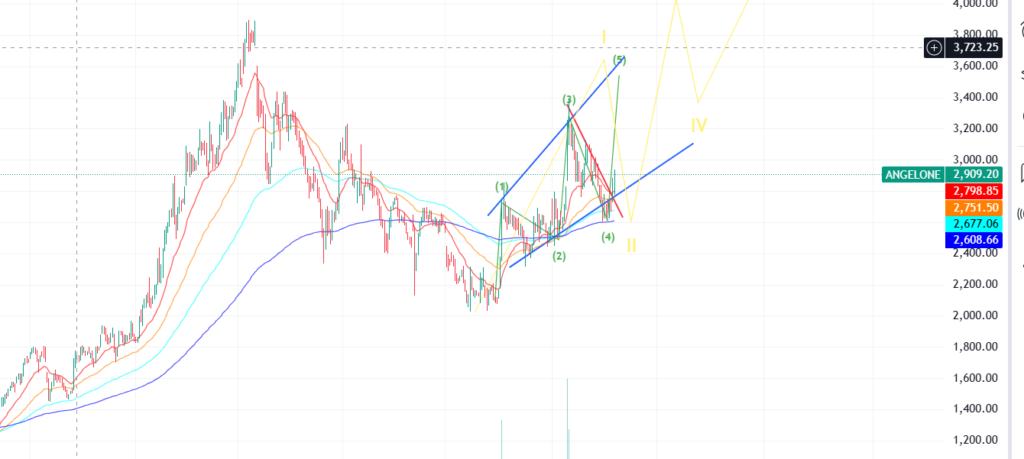
Angel One Ltd. has shown a remarkable improvement in performance over the past year, aligning with the overall growth trends in the industry. The stock price has seen an impressive surge of over 220% from April 2023 to January 2024. However, this upward trajectory was followed by a sharp decline of approximately 45% in a brief period. The prices have since stabilized around the ₹2,000 level, and the upward movement has resumed.
Our analysis at uncovermarkets.in, based on various technical factors, provides a comprehensive multi-mode evaluation of Angel One Ltd. While we have conducted an in-depth analysis, we aim to share a brief overview and our final take on the stock’s potential.
Disclaimer : We have this stock in our portfolio already. So, you must do your analysis before acting on our advice.
Before going further into detailed chart structure, we would be interested to see the basic multiples vis-a-vis its peers. Below table provides that view. It shows that P/E is not much expensive although P/B might look little expensive, however, considering the CAGR and OPM, it can’t be seen an expensive outlier. In a nutshell, this stock would perform based on its performance going forward as it is suitably prices right now.
| NAME | P/E (x) | P/B (x) | ROE % | ROA % | Rev CAGR [3Yr] | OPM |
|---|---|---|---|---|---|---|
| Angel One | 19.92 | 8.63 | 37.05 | 8.49 | 48.21 | 38.61 |
| ICICI Securities | 13.79 | 7.24 | 43.25 | 6.62 | 24.72 | 64.65 |
| JM Financial | 28.13 | 1.15 | 4.82 | 1.37 | 14.26 | 58.01 |
| Choice Intnl | 66.46 | 16.42 | 22.19 | 7.24 | 62.06 | 29.46 |
| IIFL Securities | 14.17 | 5.68 | 28.67 | 6.50 | 36.58 | 38.43 |
Let’s delve deeper into technical aspects. Here is the chart structure for Angel One:
Chart-1 shows up on the weekly plot, where key aspect to observe is the Pivot points. Price has successfully crossed key resistance level of Rs. 2631 and currently hovering at Rs.2922. So, we have a good cushion of Rs.300, until then it is in positive territory. This is just an indicative chart to look at one aspect of technical analysis but it is incomplete before analysing it without the chart structure. So, let’s move to Chart-2.

Chart-2 This chart analysis is based on EWT (Elliott Wave Theory), where we are not getting a perfect chart structure but we have assumed all possible wave structures and considered the individual direction of those waves. One of the wave structure which is most pessimistic is showing a target of around 3050, and moderate target of 3200. While more bullish structures are providing a target of 4000 – 4300, which is achievable in next 12 to 18 months, if not earlier. So, the verdict is a clear buy signal with very minimal downside of 8-10% while a potential gain of 30-40%.


